
Background
The goal of any investor is to build a diversified high sharpe ratio portfolio. As such, they must combine a number of uncorrelated, high quality return streams. Therefore, any prudent investor will want to know what correlation to expect between his or her return streams.
Investments in hedge funds, however, present a particularly difficult case. If an allocator has to base their correlation estimates on monthly return series, calculated correlations will either depend on a short history and be in danger of being spurious or will be overly backward looking.
One way to tackle these problems for hedge fund allocations in equity L/S allocations is to study the position overlap between funds. In this study we examine industry wide trends in position overlap and look at which specific pairs of funds are currently exhibiting unusually high overlap.
Methodology
Symmetric begins with a historical database of hedge fund holdings across a universe of more than one thousand funds. Because hedge funds are required to file with the SEC, we can control more effectively for survivorship and selection bias compared to hedge fund analysis that depends upon self-reporting.
To calculate the overlap among hedge funds, we measure the pairwise overlap between two hedge funds. First we isolate the top 10 positions for each fund. Let's say Fund A and Fund B both have Stock A and Stock B in their top 10 positions. In that case, the pairwise overlap between Fund A and Fund B would be 20% (2/10). We use this methodology to calculate the pairwise overlap between every possible pair in our universe.
To estimate industry wide overlap trends we calculate the average overlap amongst all the possible pairs of funds within the hedge fund universe. The average overlap is calculated for each quarter going back to 2006.
To narrow the list of pairs of funds that exhibit unusually high overlap, we restrict the universe to fundamentally driven equity long/short funds with relatively lower turnover. We then force-rank the list according to the number of pairwise overlaps and select those that have the highest overlap. During the list selection process we exclude any already selected funds from featuring into any subsequent entries in our list.
Industry Wide Position Overlap has Increased
Our prior report noted that industry wide overlap had been stable. Overlap, however, had historically exhibited a tendency to increase during times of crisis. Based on the market volatility in August and into September, we hypothesized that overlap would increase, just as it had historically during such circumstances. It did.
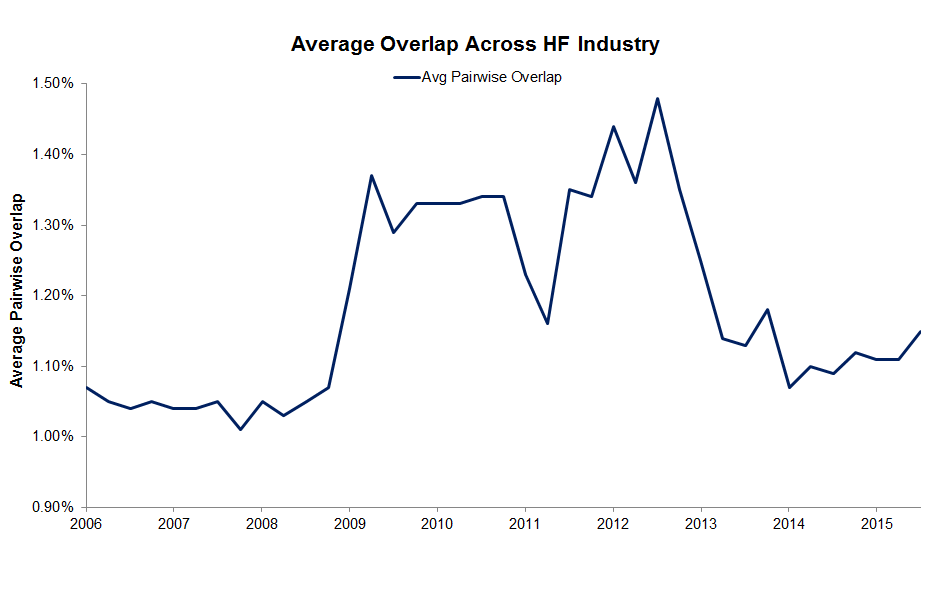 The chart shows that the overlap between managers was relatively steady before 2008. As the market-crisis worsened, it increased dramatically from the Autumn of 2008 into mid 2009. The industry wide overlap hit another high by 2012 before decreasing.
Overlap exhibited a tendency to increase during times of crisis. Hedge funds decided to increase or initiate similar high-conviction positions, while trimming others. Overlap declined as the market stabilized, going into 2011. It increased again in 2012 as markets became more unsteady. Overlap receded again through 2014 and into 2015.
The market instability in the third quarter of 2015, however, coincided with increased overlap. Just as has been the case in the past, overlap increased in equity long/short hedge funds, so more hedge fund were exposed to increasingly similar ideas.
Hedge Fund Manager Pairs with Unusually High Overlap
The table below shows ten funds with unusually high overlap with their high conviction positions.
The first and second columns refer to the first and second fund in the pair. The third column contains the number of positions that they share amongst their top 10 positions, and the fourth column lists the overlapping securities. The years listed in parenthesis next to the fund names are the average age of the fund's position in the overlapping stocks. For example, in the case of Coatue and Lone Pine, they have 5 positions in common within their top 10 positions and on average Coatue has held those 5 positions for 1.3 years, while Lone Pine has held them for 1.8 years.
| First Overlapping Fund | Second Overlapping Fund | Overlap | Overlapping Tickers |
|---|---|---|---|
| Pentwater Capital Management (.625 years) | Angelo Gordon & Company (0.5 years) | 60% | BRCM, TWC, ALTR, BHI, HUM, PRGO |
| Coatue Management (1.3 years) | Lone Pine Capital Management (1.8 years) | 50% | CHTR, FB, JD, EQIX, MSFT |
| Foxhaven Asset Managmenet (1 year) | White Elm Capital (3 years) | 50% | CHTR, LBTYK, PCLN, SBAC, EXPE |
| Meru Capital (.9 years) | Suvretta Capital Management (.7 years) | 50% | VRX, TWC, AGN, STZ, QSR |
| Valiant Capital Management (1.6 years) | Fox Point Capital Management (.7 years) | 50% | AMZN, FB, WBA, PCLN, JD |
| Brahman Capital (3 years) | Incline Global Management (1.44 years) | 40% | VRX, QVCA, ENDP, LBTYK |
| Par Capital Management (4.6 years) | Altimeter Capital Management (3.15 years) | 50% | DAL, EXPE, ALK, UAL, PCLN |
| Sivik Global Healthcare (1.1 years) | Visium Asset Management (2.5 years) | 40% | CI, AET, MCK, AGN |
| Sectoral Asset Management (7.4 years) | Iguana Healthcare Management (.9 years) | 40% | BIIB, GILD, CELG, AMGN |
| Alkeon Capital Management (2.9 years) | Conatus Capital Management (.5 years) | 40% | GOOGL, V, DLTR, AGN |
Angelo Gordon and Pentwater have the highest overlap. They share six of each of their top ten positions. The overlapping positions include positions such as BRCM and TWC which are positions that are also more popular across the hedge fund universe. But they also include PRGO, BHI and ALTR, which are more contrarian. They are not particularly common holdings in the hedge fund universe.
Coatue and Lone Pine: Their mutual holdings have held steady and not changed with the most recent filing.
Foxhaven and White Elm: White Elm initiated a position in Expedia during the past quarter, which increased their overlap with Foxhaven. Overall, however, White Elm has held their mutual positions for longer, on average, than Foxhaven
Par Capital and Altimeter: Their mutual holdings have held steady and not changed with the most recent filing. The overall StockAlpha performance of Altimeter, however, put them in the Symmetric Top Twenty for the current quarter.
Conclusion
Any prudent investor desires a portfolio of uncorrelated, high-quality returns. While hedge funds can provide an important contribution to a well constructed portfolio, understanding their correlation to one another presents multiple difficulties. To control for survivorship and selection bias, on can take a holdings-based perspective.
Our prior report illustrated two key findings from a holdings-based analysis of hedge fund correlations. We isolated the most interconnected hedge funds according to their pair-wise connections. These present a possible source of correlation based on the similarity of their high-conviction bets and warrant closer inspection. Second, the average pairwise connections between managers and their high-conviction positions rose going into the financial crisis and declined as the market recovered to pre-crisis levels.
Our current report walked the holdings based analysis of hedge fund correlations forward and tested a hypothesis we made based on our prior report. Just as the market turmoil had historically led to a greater number of average pairwise linkings between managers, we wondered if the market-volatility in August and September would lead to increased overlap within the hedge fund universe. It did.
Overlap among equity long/short hedge fund managers increased since our prior report. The increased overlap coincided with increased market volatility and mirrored hedge fund manager behvior during prior periods of market volatility.